Dog Bite Injuries and Fatalities in the United States
15 Years of Records Decoded
The Centers for Disease Control compiles a massive public health database named Wide-ranging OnLine Data for Epidemiologic Research, or WONDER for short. Their project provides a wealth of data for researchers; birth rates, cancer statistics, environmental variables - the list goes on. You can browse the topics covered, and query the system directly using the CDC WONDER web page.
Of course no epidemiological survey could help physicians without tracking the unfortunate number and causes of deaths in a given area. Beginning in 1999, WONDER implemented a coding system to track each specific cause of death called International Classification of Disease-10th Revision or ICD-10.[1]
The most common causes of death vary significantly depending on how old the deceased person is. For example, in 2011, the leading cause of death for 35-44 year olds was unintentional injury, while cancer killed three times as many people in the next age group of 45-54 year olds.[2]
The ICD-10 coding system has a code for dog bites. The code is W54, and represents injuries incurred through dog bites or strikes.[3] To determine fatality rate trends, Puppycide Database Project reviewed CDC WONDER records from 1999 through 2011.
Mortality data is just part of this story. In order to gain a more complete understanding of the rates in which people are hurt by dogs, the Puppycide Database Project used another Centers for Disease Control Database - the Web-based Injury Statistics Query and Reporting System, also called WISQARS. Our analysis includes twelve years of Non-fatal Injury Reports from 2001 through 2013. As with WONDER, WISQARS can be queried on the CDC's web site.
There are important distinctions in methodology between the two databases. Mortality rates are determined through the compilation of death certificates. While there is variation from state to state in the process that causes of death are recorded, each number in the WONDER database is representative of a specific deceased individual.
In contrast, CDC describes WISQARS data collection in the following way:
The nonfatal injury data used in WISQARS are obtained from an expansion of the National Electronic Injury Surveillance System (NEISS) operated by the U.S. Consumer Product Safety Commission (CPSC). The expanded system, called the NEISS All Injury Program (NEISS-AIP), began on July 1, 2000, and collects data about all types and external causes of non-fatal injuries and poisonings treated in U.S. hospital emergency departments (EDs)--whether or not they are associated with consumer products.[4]
Since May 1971, CPSC has used NEISS to monitor consumer product-related injuries in its regulatory jurisdiction. In the year 2000, NEISS collected information from a nationally representative sample of 100 U.S. hospital EDs. The NEISS hospitals are a stratified probability sample of all U.S. hospitals (including U.S. territories) that have at least six beds and provide 24-hour emergency services. The NEISS-AIP data are collected at 66 of the 100 NEISS hospitals, which represent the nation's range of hospital settings. NEISS and NEISS-AIP hospitals include very large inner-city hospitals with trauma centers as well as large urban, suburban, rural, and children's hospitals.[5]
These contrasting collection methods must be considered by the reader, particularly as readers seek to use data collected here in other projects. For our purposes, WISQARS data remains relevant despite reliance on statistical samples. Our concern is with trends, and particularly the comparison between similar trends.
Both mortality and non-fatal injury statistics are for the United States only.
Our review of the data has provided the following results:
Section 1. Mortality
Annually, a mean of 29.3 people were killed by dog bites and strikes during the 13 year analysis period. This average is based on the mean population during the fatal injury survey of 295,561,547.[6]
Dog Bite-Related Mortality, 1999-2011[6]
| Year | Deaths | Population |
|---|---|---|
| 1999 | 25 | 279,040,168 |
| 2000 | 26 | 281,421,906 |
| 2001 | 25 | 284,968,955 |
| 2002 | 18 | 287,625,193 |
| 2003 | 32 | 290,107,933 |
| 2004 | 27 | 292,805,298 |
| 2005 | 33 | 295,516,599 |
| 2006 | 32 | 298,379,912 |
| 2007 | 32 | 301,231,207 |
| 2008 | 27 | 304,093,966 |
| 2009 | 32 | 306,771,529 |
| 2010 | 38 | 308,745,538 |
| 2011 | 34 | 311,591,917 |
| Totals | 381 | 3,842,300,121 |
There are two primary risk groups for dog bite fatalities. Newborns and infants through age four are one such group; the second is people older than age 55[6]. Relying on intercensal Census data we determined that individuals in the two risk groups accounted for 27.8% of the population during the research period[7]. Individuals in these risk groups represented 69.6% of total deaths. Adolescents and young adults face the lease risk due to dog bite fatalities. 15-19 year olds reported absolutely no deaths during the research period, while those aged 20-34 represented 3.4% of fatalities[6].
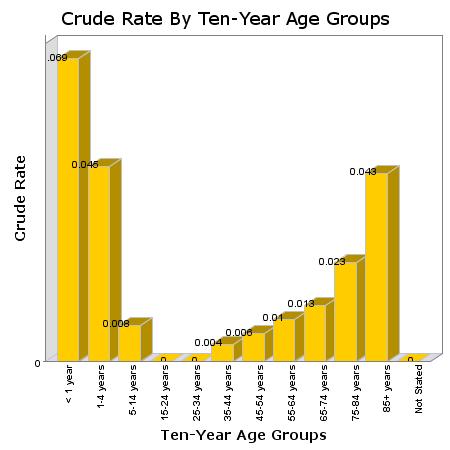
A visualization of this data helps to demonstrate these risk groups, as in the figure above which tracks dog bite deaths in ten year age groups and is based on all data compiled through the years 1999 and 2011.
Individuals in the complete non-risk group, those of ages 5 through 54, represented 72.1% of the population[7] while accounting for only 30.4% of canine related fatalities[6].
A frequently relied upon method of contextualizing these and similar issues is a comparison with leading causes of mortality. When viewed next to statistics for much more fatal phenomenon, the risks associated with even the most alarming of social problems can be better understood. As such, we have included the chart below, which compares the leading causes of mortality to dog bite related deaths in the year 2011. Note that within the years studied, 1999 through 2011, 2011 has the second highest number of dog bite related deaths (exceeded only by 2010).
Leading Causes of Death, 2011[2]
| Cause | Deaths |
|---|---|
| Heart Disease | 596,577 |
| Malignant Neoplasms (Cancer) |
576,691 |
| Chronic Respiratory Disease |
142,943 |
| Cerebro-vascular | 128,932 |
| Unintended Injury | 126,438 |
| Alzheimer's Disease | 84,974 |
| Diabetes Mellitus | 73,831 |
| Influenza & Pneumonia |
53,826 |
| Nephritis | 45,591 |
| Suicide | 39,518 |
| Dog Bites | 34 |
There is a legitimate complaint in such a comparison - that comparing dog bite mortality to, for instance, cancer mortality is an irrelevant comparison. While perhaps indicating the scope of a particular problem in the widest possible sense, such a comparison fails to provide an "apples to apples" comparison among the most similar kinds of mortality. In this case, a more specific context can be achieved through a comparison with rates of violent death only, as outlined in the table below. This next table, as with the prior table, contains information solely from 2011. Crude rates of mortality per 100,000 members of population have been added, as have the relevant ICD-10 codes for each cause of death.
Leading Causes of Violent Death, 2011[8]
| Cause & ICD-10 Code | Deaths | Rate per 100,000 |
|---|---|---|
| Unintentional Poisoning (X40-X49) |
36,280 | 11.6 |
| Car Accident (Multiple) | 33,783 | 10.8 |
| Unintentional Fall (W00-W19) |
27,483 | 8.8 |
| Suicide by Firearm (X72-X74) |
19,990 | 6.4 |
| Homicide by Firearm (U01.4,X93-X95) |
11,068 | 3.6 |
| Suicide by Suffocation (X70) |
9,913 | 3.2 |
| Suicide by Poisoning (X60-X69) |
6,564 | 2.1 |
| Unintentional Suffocation (W75-W84) |
6,242 | 2.0 |
| Unintentional Unspecified (X59) |
5,871 | 1.9 |
| Unintentional Drowning (W65-W74) |
3,556 | 1.1 |
| All Suicides[9] (U03,X60-X84,Y87.0) |
39,518 | 12.7 |
| All Homicides[9] (*U01-*U02, X85-Y09,Y87.1) |
16,238 | 5.2 |
| Dog Bites (W54) | 34 | 0.01091* |
*The number of dog bite fatalities is such a small number in comparison to the denominator total population that CDC criteria for reliability of crude rate calculation is only narrowly met. The CDC marks crude rates per population with numerators smaller than 20 as "unreliable"[10]; as the reader can see, the number of total dog bites is merely 34. The reason why this is the case is more clearly evident when the standard error for the population rate computation is provided. In this case, the standard error is 0.001871342. This leads to a real range of dog bite mortality rates per 100,000 between 0.007556685 and 0.015248021. Nevertheless, rates have been included here as such variation does little to reduce the impact of the value when viewed in context with the other items in the graph.
The Puppycide Data Project was also able to obtain data, allowing us to map which in which states the most canine-related deaths occurred. The results were somewhat surprising. Unfortunately, we were unable to obtain reliable statistics of nationwide dog ownership. That said, it is clear that dog bite deaths are not correlated with state population.
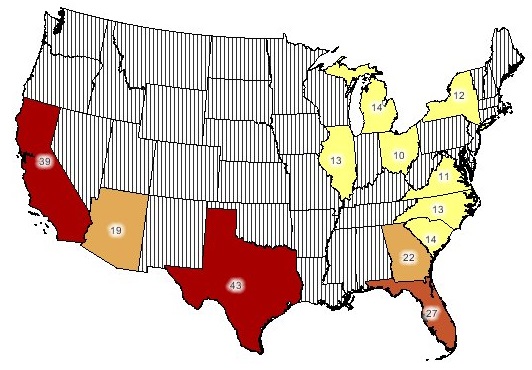
As we can see from the map, the five leading states for dog bite mortality, in descending order, are Texas, California, Florida, Georgia and Nevada. Focusing on population, the first three states (Texas, California and Florida) are among the most populous in the Union - their inclusion makes sense. However population density cannot explain these results. Georgia, with 22 fatalities, has nearly twice as many fatalities as New York, with 12.
Section 2. Non-Fatal Injuries
The Non-Fatal Injury Group consisted of a thirteen year period from 2001 through 2013. Our review of the data showed a consistent injury rate throughout the sample period.
Dog Bite-Related Non-Fatal Injuries, 2001-2013[11]
| Year | Number of Injuries | Population | Rate Per 100,000 |
|---|---|---|---|
| 2001 | 368,557 | 284,968,955 | 129.33 |
| 2002 | 331,818 | 287,625,193 | 115.36 |
| 2003 | 332,105 | 290,107,933 | 114.48 |
| 2004 | 337,848 | 292,805,298 | 115.38 |
| 2005 | 321,717 | 295,516,599 | 108.87 |
| 2006 | 310,710 | 298,379,912 | 104.13 |
| 2007 | 312,239 | 301,231,207 | 103.65 |
| 2008 | 333,235 | 304,093,966 | 109.58 |
| 2009 | 337,526 | 306,771,529 | 110.03 |
| 2010 | 346,331 | 308,745,538 | 112.17 |
| 2011 | 359,972 | 311,582,564 | 115.53 |
| 2012 | 362,724 | 313,873,685 | 115.56 |
| 2013 | 346,925 | 316,128,839 | 109.74 |
| Totals | 4,401,705 | 3,911,831,218 | 112.52 |
Males were more likely than females to to receive non-fatal injuries - Males were injured at a rate of 121.85 per 100,000 while females were injured at a rate of 106.52 per 100,000[11].
How do dog bite injuries compare to the leading causes of non-fatal injury?
Leading Causes of Non-Fatal Injury, 2013[12]
| Cause | Injuries | Rate | Number of Records |
|---|---|---|---|
| Unintentional Fall | 8,771,656 | 28.4% | 148,186 |
| Unintentional Struck by / Against | 4,214,125 | 13.6% | 72,397 |
| Unintentional Overexertion | 3,256,567 | 10.5% | 49,506 |
| Unintentional MV-Occupant | 2,462,684 | 8.0% | 46,087 |
| Unintentional Cut/Pierce | 2,077,775 | 6.7% | 32,465 |
| Unintentional Other Specified | 1,767,630 | 5.7% | 33,889 |
| Other Assault Struck by / Against | 1,291,100 | 4.2% | 24,853 |
| Unintentional Other Bite / Sting | 1,174,267 | 3.8% | 19,290 |
| Unintentional Poisoning | 1,055,960 | 3.4% | 19,555 |
| Unintentional Unknown / Unspecified | 819,878 | 2.7% | 14,850 |
| Dog Bites | 346,925 | 1.1% | 5,854 |
| Total Injuries | 30,888,063 | - | 533,465 |
In the table above, "Other Assaults" represent all assaults not including sexual assault, which is tracked by the CDC using a unique category. "Other Bite / Sting" are all animal bites and stings which are not dog bites; please note that this is another categorical distinction put into place by CDC and not by the Puppycide Database Project analysis of CDC data. Unlike mortality statistics, the CDC's annualized national estimates are based on emergency department visits from July 1st to December 31st, 2000. While this is the best of such data currently available, this methodology should be kept in mind.
Injury statistics become more revealing when viewed by age group along side fatality statistics:
Dog Bite-Related Non-Fatal Injuries
by Age Group, 2001-2013[11]
| Number of Injuries | Population | *Rate % | |
|---|---|---|---|
| Risk Group | 1,101,501 | 1,188,045,145 | 0.092715% |
| Non-Risk Group | 3,300,102 | 3,653,046,244 | 0.090338% |
Let's place the same results alongside our earlier review of our previous mortality review to more clearly see the trend:
Dog Bite-Related Morbidities and Injuries
by Age Group, 2001-2013[6][11]
Injuries
| Injuries | Population | *Rate % | |
|---|---|---|---|
| Risk Group | 1,101,501 | 1,188,045,145 | 0.092715% |
| Non-Risk Group | 3,300,102 | 3,653,046,244 | 0.090338% |
Morbidities
| Deaths | Population | *Rate % | |
|---|---|---|---|
| Risk Group | 265 | 1,138,633,031 | 0.000023274% |
| Non-Risk Group | 116 | 2,703,667,090 | 0.00000429% |
*Note that in the graphs above, Rate % is a function of the number of deaths or injuries divided by the population of the relevant risk group. The population and injury numbers are totals from the entire respective research period. This is distinct from Rate or Crude Rate, which is the number of attacks per 100,000 population members.
With both datasets side by side it becomes obvious that the infant and elderly risk groups that were apparent in the fatality study do not exist among non-fatal injury statistics. How can we account for this? Looking at fatality trends out of context, it is easy to be lead to believe that dogs are more likely to attack people who cannot fight back. After all, the less ambulatory an age group, the more likely they are to die from a dog bite. However, the non-fatal injuries are currently our best indicator of dog *attacks*. And they demonstrate that dogs attack human beings in all age groups in almost perfect unison with that age groups percentage of the overall population.
How, then, are we to explain the deaths? Infants and the elderly are more likely to die because infants and the elderly are more likely to die from nearly all injuries and ailments. The age group trend in canine fatalities are correlational and not causative. This last point cannot be stressed enough, as the data is clear. Age plays no deterministic role in canine aggression.
In the final installment of this analysis, we will provide our remaining findings - focusing on detailing canine fatalities by urban sprawl, injury outcomes and the financial burden of dog bites.
Section 3a. Acknowledgements
This paper owes a great debt to both the National Canine Research Council (NCRC) and the Animals and Society Institute (ASI). Specifically, Dog Bites: Problems & Solutions 2nd Edition by Janis Bradley and the comprehensive series of research published by the NCRC on the topic of Injurious Dog Bites. Without coming across these two organizations it could easily be assumed that reputable research on the topic of canine violence outside of veterinary medicine simply does not exist.
Some segments of NCRC's review of dog bite data coincided with the research performed in this paper. NCRC relied on the CDC WONDER database for a review of dog mortality with leading causes of death. Our respective analysis of the WONDER database resulted in similar results of dog fatality risk groups. While both NCRC's review and this paper share a similar point of departure, that is the sole area of common interest. This paper focuses on Non-fatal injury trends and human demographic interests with both of those research groups. NCRC focuses on trends in dog breed and the relationship between the dog and the individual ultimately bitten or struck by that dog.
Compilation of the data used in this paper made it apparent to the authors that there is a dearth in research concerning the topic of canine violence. This is particularly concerning given the prevalence of breed-specific legislation and the continuous media attention of both dog attacks of humans and police assaults on dogs. The policies which form the justification of both the legislation and the approach to community policing and animal control that leads to these events are not based on sound research. The relationship between human beings is ruled by emotions, both positive and negative. Prudent public policy can only be attained through the compilation and analysis of empirical observation.
Section 3b. References
- ^ " International Classification of Diseases, Tenth Revision, Clinical Modification (ICD-10-CM)" National Center for Health Statistics Centers for Disease Control and Prevention (CDC)
- ^ a b " 10 Leading Causes of Death by Age Group, United States – 2011". National Vital Statistics System. National Center for Health Statistics. National Center for Injury Prevention and Control. Centers for Disease Control and Prevention (CDC) using WISQARS™. CDC Copy of Source Document.
- ^ " International Statistical Classification of Diseases and Related Health Problems 10th Revision." Chapter XX External Causes of Morbidity and Mortality (V01-Y98). World Health Organization.
- ^ WISQARS Nonfatal Help Menu. The National Electronic Injury Surveillance System (NEISS)
- ^ U.S. Consumer Product Safety Commission. The NEISS sample: design and implementation. In: Kessler E, Schroeder T, eds. Washington, DC: US Consumer Product Safety Commission, 2000.
- ^ a b c d e f "Compressed Mortality File 1999-2011 Series." 20 No. 2Q, 2014. 1999-2011 on CDC WONDER Online Database, released July 2014. National Center for Health Statistics. Centers for Disease Control and Prevention (CDC).
- ^ a b "Intercensal Estimates of the United States Population by Age and Sex, 1990-2000." October 09, 2012. U.S. Census Bureau.
- ^ " 10 Leading Causes of Injury Deaths by Age Group Highlighting Violence-Related Injury Deaths, United States – 2011". National Vital Statistics System. National Center for Health Statistics. National Center for Injury Prevention and Control. Centers for Disease Control and Prevention (CDC) using WISQARS™. CDC Copy of Source Document.
- ^ a b “Deaths: Final Data for 2011.” National Vital Statistics Report (NVSR). Volume 63, Number 3. National Center for Health Statistics. Centers for Disease Control and Prevention (CDC). CDC Copy of Source Document.
- ^ " Compressed Mortality File 1968-2011, Frequently Asked Questions about Compressed Mortality, Section F". "Death rates based on counts less than twenty (death count <=20) are flagged as 'Unreliable'. A death rate based on fewer than 20 deaths has a relative standard error (RSE(R))of 23 percent or more. A RES(R ) of 23 percent is considered statistically unreliable." Centers for Disease Control and Prevention (CDC).
- ^ a b c d Web-based Injury Statistics Query and Reporting System (WISQARS). (2003). National Center for Injury Prevention and Control. Centers for Disease Control and Prevention (CDC).
- ^ National Estimates of the 10 Leading Causes of Nonfatal Injuries Treated in Hospital Emergency Departments, 2011. National Center for Injury Prevention and Control. NEISS All Injury Program operated by the Consumer Product Safety Commission (CPSC).
References for Section 1, Mortality
References for Section 2, Non-Fatal Injuries